
Sparktrade.io is an AI-powered stock analysis and prediction platform that is built for both institutional and retail investors alike. Our software can be used to generate stock ideas, inform better trading decisions, supplement trading strategies, and even a “Trade With Us” feature to mimic our portfolio.

Low scores (e.g. less than 50) on either Prediction index do not indicate a high probability of the opposite move. Rather, they indicate a low probability of a significant move in the prescribed direction.
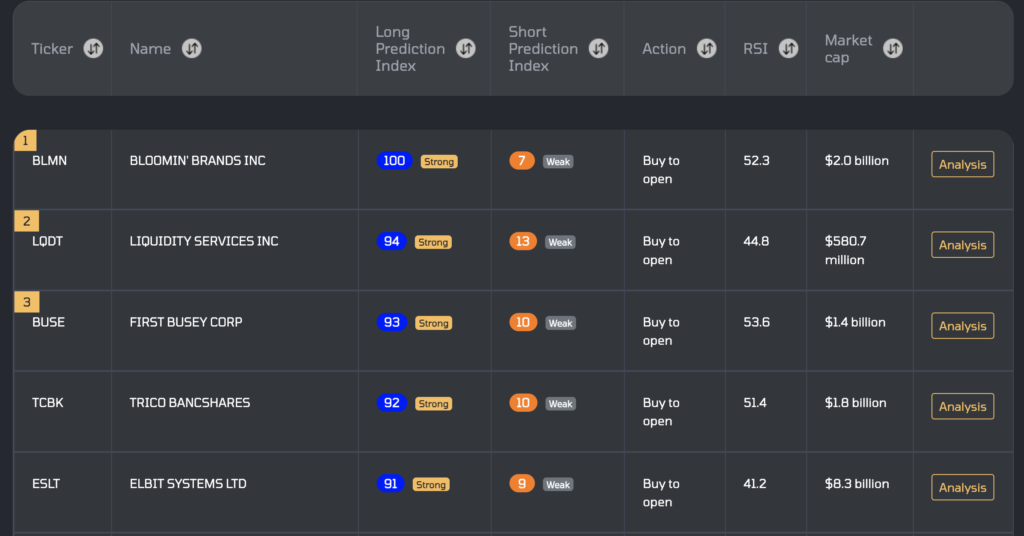
After years of research and development, our team of financial data scientists finalized SparkTrade.io’s proprietary machine learning algorithm and distilled it into one simple number: SparkTrade.io’s Prediction Index. Prediction indexes are direct outputs from SparkTrade.io’s machine learning model, which attempts to identify when a stock is likely to increase or decrease in value by more than 3 times the daily volatility over the next few weeks. The Prediction index is a range from 0 to 100 with a higher value (e.g. 90+) meaning a higher probability that the stock will hit its target. A long and a short prediction index score is generated each day for over 3,500 US listed equities.

SparkTrade’s prediction indexes are generated using an advanced whole-market machine learning algorithm. Over 20 years of historical pricing, fundamental, and industry composition data are processed daily to discover which stocks are the best candidates to open long or short trades for the coming days and weeks.

Unlike the rules-based systemic algorithms that competitors pass off as machine learning, SparkTrade uses a random forest model that is rigorously tested via purged k-fold cross validation on out-of-sample data.
Each stock on our platform contains price charts along with a historical graph of the Long Prediction index and Short Prediction Index. Each chart can be filtered to show the trailing twelve months, trailing twelve weeks, or trailing 30 days. Along with the price and Prediction Index charts, users can find stock specific information like common reporting ratios and highlights from income statements, balance sheets, and cash flow, which can be filtered to show yearly, quarterly, or trailing twelve-month aggregations.
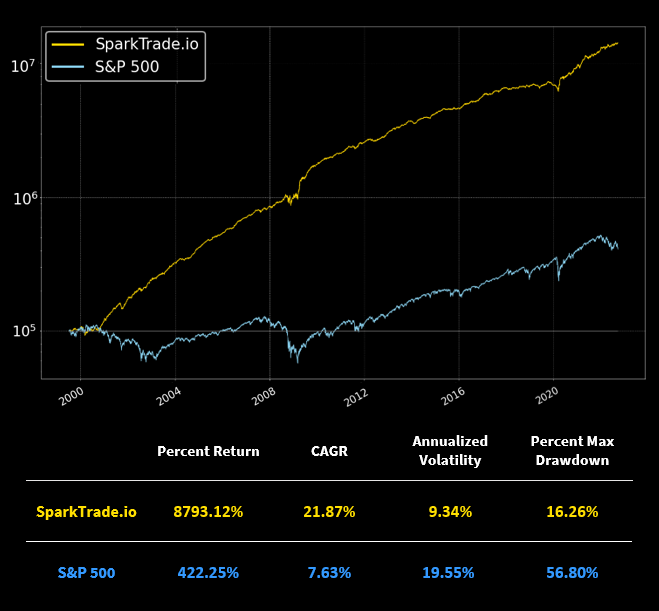
The backtest started on the first day of trading in January of 1999 and ended on October 6th, 2022. SparkTrade.io’s strategy used a combination of the top-rated stocks based on our Long and Short Prediction Indexes. There were a maximum of 25 long and 25 short positions in the portfolio at any given time, and we used a capital allocation of 2:1 (Long:Short). SparkTrade’s average number of transactions per day was 13.5, including closing and opening positions. The average position length was between 3 to 6 days.
The model’s trading decisions in the backtest are based on strictly out-of-sample data. We use the financial industry’s leading standard, the purged k-fold cross validation technique, to ensure that our model in the backtest is not overfitting and providing inflated results. Our rigorous backtesting standards have helped us build confidence in our model in all types of market conditions.

In trading, the question is not if you experience drawdowns, it’s when. Actively managed funds must minimize drawdowns and decrease the amount of time it takes to rebound when the inevitable drawdown happens. Here is a list of the SparkTrade algorithm’s worst drawdowns in the backtest and the amount of time it took to reach new all-time highs:
The goal of actively managed portfolios is to produce greater returns with less downside volatility. Through continuous data collection and daily processing of our model, we aim to make this goal a reality for our users.
|
Max Drawdown Date
|
Max Drawdown
|
S & P Drawdown
|
Period Start
|
Period End
|
Duration (days)
|
|---|---|---|---|---|---|
|
3/7/2000
|
16.26%
|
12.88%
|
1/12/2000
|
11/20/2000
|
218
|
|
2/19/2020
|
14.71%
|
33.70%
|
10/9/2019
|
4/6/2020
|
124
|
|
2/9/2021
|
11.81%
|
4.06%
|
1/6/2021
|
3/23/2021
|
53
|
|
6/8/2020
|
8.08%
|
6.99%
|
4/21/2020
|
8/11/2020
|
79
|
|
11/20/2008
|
8.06%
|
19.62%
|
11/6/2008
|
1/2/2009
|
39
|
|
6/28/2021
|
7.90%
|
2.77%
|
5/14/2021
|
8/16/2021
|
65
|
|
10/16/2001
|
7.31%
|
14.12%
|
9/4/2001
|
11/16/2001
|
50
|
|
3/5/2014
|
6.15%
|
5.70%
|
11/11/2013
|
4/7/2014
|
101
|
|
10/9/2008
|
6.02%
|
33.99%
|
9/3/2008
|
10/28/2008
|
40
|
|
9/7/2021
|
5.90%
|
4.01%
|
8/19/2021
|
9/21/2021
|
23
|
*Through our ten worst drawdowns in the backtest, the average duration for our portfolio to reach a new all-time high was 79.2 days.
SparkTrade is built for investors at any experience level and can be used in a variety of ways. The Prediction Index can be the base for a new strategy, or a supplement to an existing strategy. Here are a few ways SparkTrade can be utilized to help generate alpha for any strategy:
Our team of technology and financial professionals founded SparkTrade with one common purpose: to democratize AI and Machine Learning for all investors. Throughout our experience in the industry, we were able to see the inequality in the technology available between large financial institutions and the common retail investor. It is our belief that a greater number of informed market participants cultivates a healthy stock market, and an individual’s net worth shouldn’t determine accessibility to top-tier investment tools. We built SparkTrade.io with technology that we believe in, so much so that we are investing our own capital in the strategies we are sharing with you. We invite you to Trade With Us.
When you “Trade With Us”, you get a live feed of our long and short entry and exit signals, as well as our portfolio breakdown, to see exactly how we are trading. Our strategy uses advanced AI/machine learning methods, including SparkTrade.io’s Prediction Index, to place trades and actively manage our portfolio.
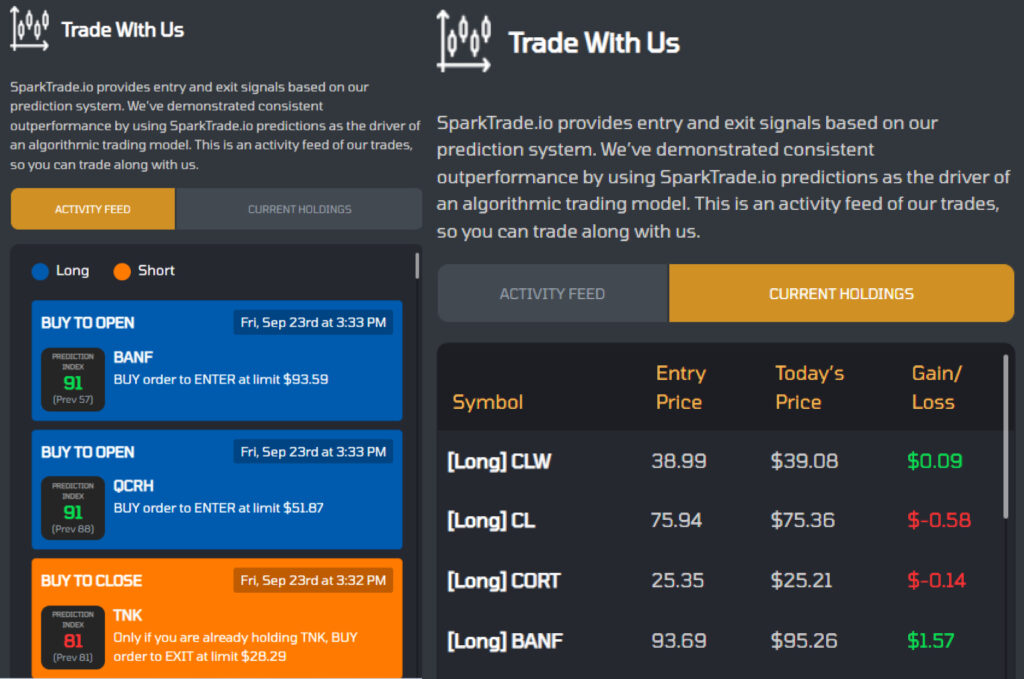

We are a team of technology and financial executives with experience in financial data analysis, machine learning, and Software as a Service. Together, our extensive knowledge of the financial industry and data science, along with our passion to “solve” the stock market, allowed us to create a comprehensive machine learning model built for all market conditions. Our confidence in the SparkTrade model is backed by a vested interest; we actively trade SparkTrade’s signals in our own investment accounts. Follow all of our trades with the Trade With Us feature and see a real time view of our portfolio with a comprehensive breakdown of each position.